Getting Started with the News API Part 2: Insights
Introduction
Welcome to Part 2 of our Getting Started with the News API series. In Part 1 we introduced you to the API, the demo/query builder and the supporting interactive documentation. We also showed you how to perform a variety of basic searches to help you get familiar with the API.
Today we’ll begin to explore some of the more advanced capabilities that the API has to offer from an analysis and insights point of view. Whether you’re pushing data from the News API into an app, resurfacing the analysis in a news feed or building intuitive dashboards with the extracted data, the News API enables you to obtain a deep understanding for what’s happening in the news, in near real-time.
With this in mind, we’ll today be focusing on getting you up to speed with the following features;
- Time Series - leveraging time stamped data
- Sentiment - comparing the positive/negative polarity in author opinion
- Trends - uncovering useful insights
Before you go any further - have you created an AYLIEN account?
If not, we recommend you sign up for your Free trial and head back to Part 1 to learn the basics of search, making calls and creating specific search queries;
If you’ve created your account already and learned how to perform basic searches in Part 1, let’s get cracking with Part 2, starting with the Time Series endpoint.
Making calls:
We’ve created SDKs for some of the most popular programming languages which make using the API super easy. Just like Part 1, we’ve also included some code snippets for you to copy and build on.
Results:
News API results are returned in JSON format, making it easy for you to do as you please with the data. Throughout this post, we will be displaying charts and graphs that we generated using the JSON results returned from the code snippet examples provided.
1. Time Series - leveraging time stamped data
A Time Series is a sequence of data points plotted over a specified time period. The News API /time_series endpoint can be used to analyze a set of data points relative to this specified period. This makes it easy to analyze timestamped data, allowing you to easily visualize the data in an understandable and meaningful format.
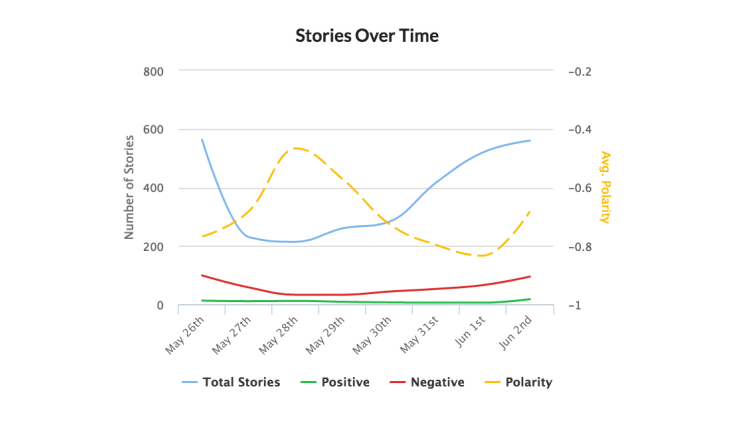
In keeping with our analysis of the US Presidential election from Part 1, we’ll use the following example: get the daily volume of stories mentioning Trump in the title over the past 60 Days.
import aylien_news_api
from aylien_news_api.rest import ApiException
from pprint import pprint as pp

aylien_news_api.configuration.api_key['X-AYLIEN-NewsAPI-Application-ID'] = 'YOUR_APP_ID'
aylien_news_api.configuration.api_key['X-AYLIEN-NewsAPI-Application-Key'] = 'YOUR_APP_KEY'
api_instance = aylien_news_api.DefaultApi()

opts= {
    'title': 'Trump',
    'published_at_start': 'NOW-60DAYS',
    'published_at_end': 'NOW/DAY',
    'period': '+1DAY'
}

try:
    ## Make a call to the Timeseries endpoint
    api_response = api_instance.list_time_series(**opts)
    pp(api_response)

except ApiException as e:
    pp('Exception when calling DefaultApi->list_stories: %s
' % e)
Note: Make sure you replace the APP_ID and APP_KEY placeholders with your own API credentials. Again, if you haven’t got an API account you can sign up here.
Visualized Results
As we mentioned earlier, because the News API returns results in JSON format, you can display the results as you please. Here’s an example of a chart we built using the results obtained from the snippet above.
Visit our documentation for more info on the Time Series endpoint.
2. Trends: Sentiment Analysis
Now let’s dive a little deeper by using the /Trends endpoint to look at the levels of sentiment within the stories about a topic. We’re narrowing our search parameters to only include stories from the past two days and from CNN and Fox News only; Search stories from sources CNN and Fox News in the US mentioning Trump from the past 14 Days
import aylien_news_api
from aylien_news_api.rest import ApiException
from pprint import pprint as pp

aylien_news_api.configuration.api_key['X-AYLIEN-NewsAPI-Application-ID'] = 'YOUR_APP_ID'
aylien_news_api.configuration.api_key['X-AYLIEN-NewsAPI-Application-Key'] = 'YOUR_APP_KEY'
api_instance = aylien_news_api.DefaultApi()

## Add the field you want to retrieve data on
field = 'sentiment.body.polarity'

opts= {
    'text': 'Trump',
    'source_name': ['CNN', 'Fox News'],
    'published_at_start': 'NOW-14DAYS',
    'published_at_end': 'NOW'
}

try:
    ## Make a call to the Trends endpoint using the operators and field arguments
    api_response = api_instance.list_trends(field, **opts)
    pp(api_response)

except ApiException as e:
    pp('Exception when calling DefaultApi->list_stories: %s
' % e)
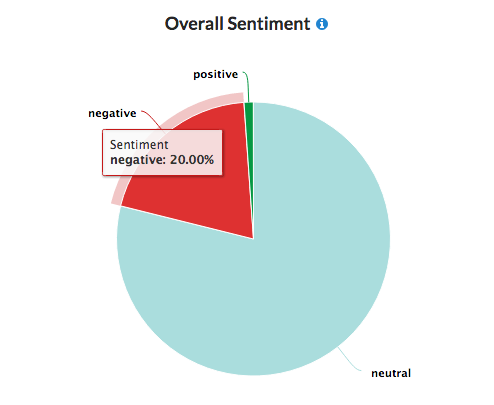
By displaying our results on a pie chart, we can clearly see that negative sentiment far outweighs positive in our returned stories. By narrowing our search parameters we have the opportunity to compare and contrast sentiment polarity towards various entities from numerous sources, locations and so on. Your options and level of search flexibility here are pretty much endless.
Visualized Results
Visit our documentation for more info on the Sentiment Analysis features.
3. Trends - Most-Mentioned Entities
Using the /trends endpoint also enables you to identify the most frequently mentioned keywords, entities and topic categories. Put simply, it allows you to measure the amount of times that specific elements of interest are mentioned in the content you source through the API.
We’re going to perform the following search to uncover the most mentioned entities from election-related stories over the past two days; Search stories from sources in the US mentioning Tesla from the past 7 Days.
import aylien_news_api
from aylien_news_api.rest import ApiException
from pprint import pprint as pp

aylien_news_api.configuration.api_key['X-AYLIEN-NewsAPI-Application-ID'] = 'YOUR_APP_ID'
aylien_news_api.configuration.api_key['X-AYLIEN-NewsAPI-Application-Key'] = 'YOUR_APP_KEY'
api_instance = aylien_news_api.DefaultApi()

field = 'entities.body.text'

opts= {
    'title': 'Tesla',
    'published_at_start': 'NOW-7DAYS',
    'published_at_end': 'NOW'
}


try:
    api_response = api_instance.list_trends(field, **opts)
    pp(api_response)

except ApiException as e:
    pp('Exception when calling DefaultApi->list_stories: %s
' % e)
Visualized Results
We’ve generated the word cloud below to visualize our results. As you can see, the two presidential candidates and their parties are, unsurprisingly, the most mentioned entities from the stories we sourced.
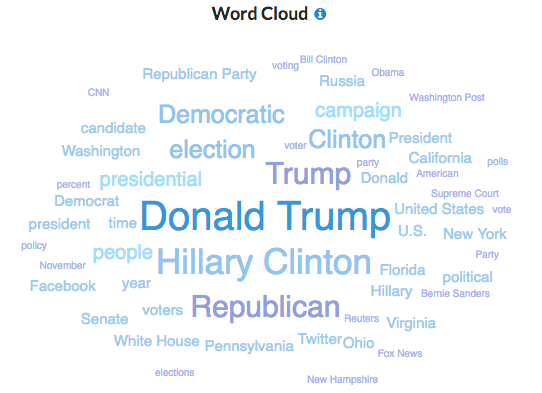
Of perhaps greater interest, however, are the lesser mentioned (but still very prevalent) entities that can help give us an insight into the key topics that have been discussed in recent days. For example;
Pennsylvania, Ohio, Florida: What is so important about these three most-mentioned states? Since 1960, no US president has been elected without claiming at least two of these states in the election. Aaah!
Visit our documentation for more info on the /trends endpoint.
Next steps
Now that you have learned the basics of using the News API you can start to further explore the various features and endpoints available to you. We’ve laid out everything you need in our interactive documentation with SDKs available in popular programming languages.[/vc_column_text][/vc_column][/vc_row]

Related Content
-
 General
16 Feb, 2024
Why AI-powered news data is a crucial component for GRC platforms

Ross Hamer
4 Min Read
-
General
24 Oct, 2023
Introducing Quantexa News Intelligence
Ross Hamer
5 Min Read
-
 Product
15 Mar, 2023
Introducing an even better Quantexa News Intelligence app experience
Ross Hamer
4 Min Read
Stay Informed
From time to time, we would like to contact you about our products and services via email.