Every day, we generate huge amounts of text online, creating vast quantities of data about what is happening in the world and what people think. All of this text data is an invaluable resource that can be mined in order to generate meaningful business insights for analysts and organizations.
But analyzing all of this content isn’t easy, since converting text produced by people into structured information to analyze with a machine is a complex task. In recent years though, Natural Language Processing and Text Mining has become a lot more accessible for data scientists, analysts, and developers alike.
There is a massive amount of resources, code libraries, services, and APIs out there which can all help you embark on your first NLP project. For this how-to post, we thought we’d put together a three-step, end-to-end guide to your first introductory NLP project. We’ll start from scratch by showing you how to build a corpus of language data and how to analyze this text, and then we’ll finish by visualizing the results.
We’ve split this post into 3 steps. Each of these steps will do two things: show a core task that will get you familiar with NLP basics, and also introduce you to some common APIs and code libraries for each of the tasks. The tasks we’ve selected are:

 If you run into any issues with these scripts, big or small, please leave a comment below and we’ll look into it. We always try to anticipate any problems our own users might run into, so be sure to let us know!
That concludes our introductory Text Mining project with Python. We hope it gets you up and running with the libraries and APIs, and that it gives you some ideas about subjects that would interest you. With the world producing content on such a large scale, the only obstacle holding you back from an interesting project is your own imagination!
Happy coding!
If you run into any issues with these scripts, big or small, please leave a comment below and we’ll look into it. We always try to anticipate any problems our own users might run into, so be sure to let us know!
That concludes our introductory Text Mining project with Python. We hope it gets you up and running with the libraries and APIs, and that it gives you some ideas about subjects that would interest you. With the world producing content on such a large scale, the only obstacle holding you back from an interesting project is your own imagination!
Happy coding!

-
- Building a corpus — using Tweepy to gather sample text data from Twitter’s API.
- Analyzing text — analyzing the sentiment of a piece of text with our own SDK.
- Visualizing results — how to use Pandas and matplotlib to see the results of your work.
Step 1. Build a Corpus
You can build your corpus from anywhere — maybe you have a large collection of emails you want to analyze, a collection of customer feedback in NPS surveys that you want to dive into, or maybe you want to focus on the voice of your customers online. There are lots of options open to you, but for the purpose of this post we’re going to use Twitter as our focus for building a corpus. Twitter is a very useful source of textual content: it’s easily accessible, it’s public, and it offers an insight into a huge volume of text that contains public opinion. Accessing the Twitter Search API using Python is pretty easy. There are lots of libraries available, but our favourite option is Tweepy. In this step, we’re going to use Tweepy to ask the Twitter API for 500 of the most recent Tweets that contain our search term, and then we’ll write the Tweets to a text file, with each Tweet on its own line. This will make it easy for us to analyze each Tweet separately in the next step. You can install Tweepy using pip:pip install tweepy>>> import tweepy
import tweepy, codecs

## fill in your Twitter credentials
consumer_key = ‘your consumer key here’
consumer_secret = ‘your consumer secret key here’
access_token = ‘your access token here’
access_token_secret = ‘your access token secret here’

## let Tweepy set up an instance of the REST API
auth = tweepy.OAuthHandler(consumer_key, consumer_secret)
auth.set_access_token(access_token, access_token_secret)
api = tweepy.API(auth)

## fill in your search query and store your results in a variable
results = api.search(q = "your search term here", lang = "en", result_type = "recent", count = 1000)

## use the codecs library to write the text of the Tweets to a .txt file
file = codecs.open("your text file name here.txt", "w", "utf-8")
for result in results:
	file.write(result.text)
	file.write("\n")
file.close()
Step 2. Analyze Sentiment
So once we’ve collected the text of the Tweets that you want to analyze, we can use more advanced NLP tools to start extracting information from it. Sentiment analysis is a great example of this, since it tells us whether people were expressing positive, negative, or neutral sentiment in the text that we have. For sentiment analysis, we’re going to use our own AYLIEN Text API. Just like with the Twitter Search API, you’ll need to sign up for the free plan to grab your API key (don’t worry — free means free permanently. There’s no credit card required, and we don’t harass you with promotional stuff!). This plan gives you 1,000 calls to the API per month free of charge. Again, you can install using pip:
<span style="font-weight: 400;">pip install aylien-apiclient</span>
>>>from aylienapiclient import textapi
>>>from aylienapiclient import textapi
>>>client = textapi.Client("Your_app_ID", "Your_application_key")
>>>sentiment = client.Sentiment({'text': 'enter some of your own text here'})
>>>print(sentiment)
from aylienapiclient import textapi
import csv, io

## Initialize a new client of AYLIEN Text API
client = textapi.Client("your_app_ID", "your_app_key")

with io.open('Trump_Tweets.csv', 'w', encoding='utf8', newline='') as csvfile:
	csv_writer = csv.writer(csvfile)
	csv_writer.writerow(["Tweet", "Sentiment"])
	with io.open("Trump.txt", 'r', encoding='utf8') as f:
	    for tweet in f.readlines():
	    	## Remove extra spaces or newlines around the text
	    	tweet = tweet.strip()

	    	## Reject tweets which are empty so you don’t waste your API credits
	    	if len(tweet) == 0:
	    		print('skipped')
	    		continue

	    	print(tweet)

	    	## Make call to AYLIEN Text API
	    	sentiment = client.Sentiment({'text': tweet})

	    	## Write the sentiment result into csv file
	    	csv_writer.writerow([sentiment['text'], sentiment['polarity']])
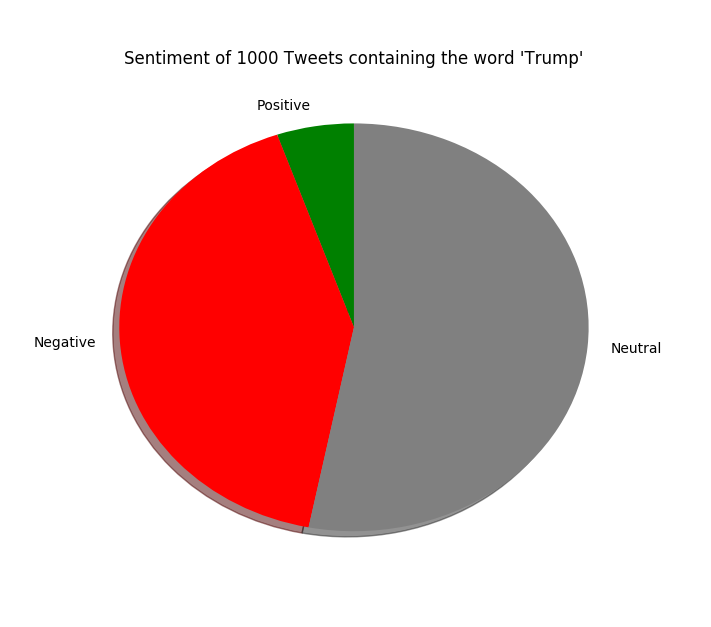
Step 3. Visualize your Results
So far we’ve used an API to gather text from Twitter, and used our Text Analysis API to analyze whether people were speaking positively or negatively in their Tweet. At this point, you have a couple of options with what you do with the results. You can feed this structured information about sentiment into whatever solution you’re building, which could be anything from a simple social listening app or a even an automated report on the public reaction to a campaign. You could also use the data to build informative visualizations, which is what we’ll do in this final step. For this step, we’re going to use matplotlib to visualize our data and Pandas to read the .csv file, two Python libraries that are easy to get up and running. You’ll be able to create a visualization from the command line or save it as a .png file. Install both using pip:
pip install matplotlib
pip install pandas
## import the libraries
import matplotlib.pyplot as plt
import pandas as pd
from collections import Counter
import csv

## open up your csv file with the sentiment results
with open('your_csv_file_from_step_2.csv', 'r', encoding = 'utf8') as csvfile:
	## use Pandas to read the “Sentiment” column,
        df = pd.read_csv(csvfile)
	sent = df["Sentiment"]

## use Counter to count how many times each sentiment appears
## and save each as a variable
	counter = Counter(sent)
	positive = counter['positive']
	negative = counter['negative']
	neutral = counter['neutral']

## declare the variables for the pie chart, using the Counter variables for “sizes”
labels = 'Positive', 'Negative', 'Neutral'
sizes = [positive, negative, neutral]
colors = ['green', 'red', 'grey']
yourtext = "Your Search Query from Step 2"

## use matplotlib to plot the chart
plt.pie(sizes, labels = labels, colors = colors, shadow = True, startangle = 90)
plt.title("Sentiment of 200 Tweets about "+yourtext)
plt.show()
Related Content
-
 General
16 Feb, 2024
Why AI-powered news data is a crucial component for GRC platforms

Ross Hamer
4 Min Read
-
General
24 Oct, 2023
Introducing Quantexa News Intelligence
Ross Hamer
5 Min Read
-
 Product
15 Mar, 2023
Introducing an even better Quantexa News Intelligence app experience
Ross Hamer
4 Min Read
Stay Informed
From time to time, we would like to contact you about our products and services via email.